The most challenging part of estimating deer population sizes comes once the calculations have been done. The numbers produced by the surveys can be interpreted in a variety of ways. Again, it is entirely dependent on the goals of the landowner and the property itself. Below are some examples of how to interpret density estimates.
Example 1:
A farmer owns a property in the midlands that is primarily composed of fields used to cultivate row crops with small hardwoods stands that run along a creek and some pine stands that are staggered throughout the property. The property is 500 acres with 250 of those acres dedicated to growing a rotation of corn and soybeans. The remaining acreage is wooded and the farmer leases the hunting rights out that are leased per acre. The farmer’s crop yield has dropped recently and often gets damaged during the growing season. There has been an increase in the number of deer the farmer has seen, which leads the farmer to believe that deer are the source of the damage. The farmer then decides to conduct a survey using trail cameras. Five cameras are placed evenly across the property (1 camera per 100 acres). After conducting the survey, the farmer finds that the deer density is 30 deer per square mile.
Is this considered a high density?
To answer that, the context of the individual property is important. Half of the property is dedicated to cropland alone. The remaining half consists of some forested areas, but also includes the farmer’s residence and yard. So, while half is cropland, the other half is not made up entirely of suitable deer habitat. In this scenario, a density of 30 deer per square mile is considered high. Without consistent and quality forage, deer often turn to cropland to supplement their diets. While the row crops can technically support deer at this density, these crops are not meant for them. The deer existing at this density are a detriment to the farmer and will likely cause large amounts of damage if left unmanaged.
What are the next steps?
While the deer density is high, hope is not lost. Remember, there are hunters who have access to the land during deer season. The farmer can reduce the density of deer on the property by working with the hunters. If the farmer wants to reduce the deer population to a manageable level, the hunters can harvest two does for every buck harvested. If the farmer surveys the land again and finds that deer populations are at an acceptable level, then one doe can be harvested per buck harvested. This should prevent any rapid increase in population size. The hunters may be concerned about the number of deer they see per hunt, and they may certainly see fewer deer. However, the deer they do see will be healthier and larger since they are no longer in constant competition with one another for resources.
Example 2:
A land manager owns 200 acres of mixed pine and hardwood forest in the low country. The property is primarily used for deer hunting that is hunted by a hunt club made up of 8 hunters. The hunt club wants to know what the deer density is to see how they should be managing it. They set out two baited trail cameras and conducted a population survey. They calculate the results and find out there are 30 deer per square mile.
Is this considered high density?
While the density is the same as the farmer’s estimated density from Example 1, 30 deer per square mile is not considered high given that the property is managed for deer. If the hunt club does not have to worry about deer threatening crops and assuming there is high quality browse throughout the property, this population is sustainable. Further management of the land is up to the discretion of the hunt club. One potential option is maintaining the current harvest regime while growing plants that provide high quality food and habitat. This will likely lead to a healthier overall population. If the hunt club wishes to increase the density, then they can harvest fewer does per year. Caution must be used when increasing the density of deer on a property since disease travels through a population faster when they are densely populated.
What can be learned from these examples?
These examples are simplified and are not based on real scenarios, but there are some key takeaways that will prove useful when it comes to managing deer populations. In both examples, the deer density was the same but this was only considered a very high density in the first example. It is important to understand why this is the case. While both properties had 30 deer per square mile, the carrying capacity and goals of the landowners were different. In Example 1, much of the property was used for row crops that the farmer relies on to make a living. Deer at higher densities will cause more damage to cropland. Therefore the farmer could not tolerate deer at high densities due to the risk of crop loss. The specific regions in these examples also play a part in the number of deer that can be supported. Some parts of the state have the ability to support more deer based on access to resources and climate.
The goal of the landowners in Example 2 were very different from Example 1. The hunt club's primary goal was to provide hunting opportunities for its members. In this case, the landowners were not only tolerant of deer - they wanted to keep them at a higher density. These examples were provided to illustrate that no properties will have the same values for what densities are considered high and what densities are considered low.

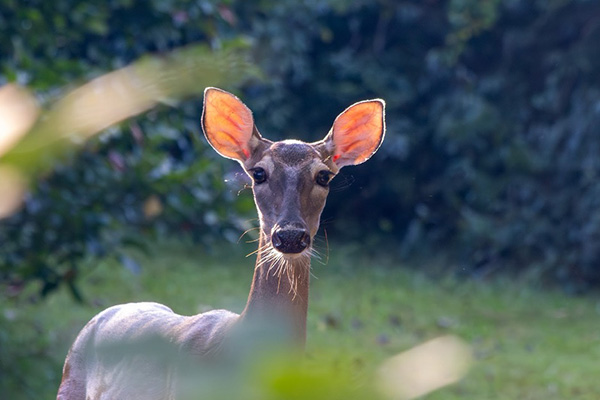
(Photo by Adobe Stock)