Operational Risk
A Continuous Cycle
Evaluating operational risk occurs on a continuous cycle and includes four main steps:
- Identify and Prioritize
- Assess
- Mitigate/Control
- Report
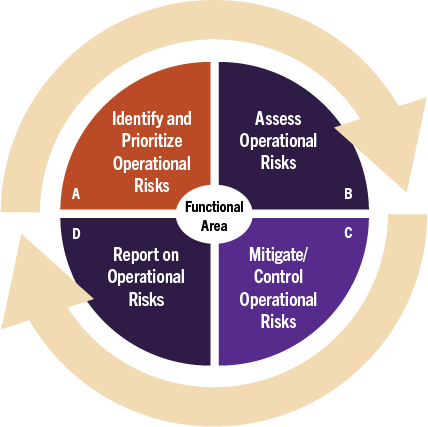
The Operational Risk Continuous Cycle pie chart is a four-slice chart in Clemson branded colors. The slice labeled A showcases that this is the first step of the cycle and is titled: Identify and Prioritize Operational Risks. Slice B is titled Assess Operational Risks. Slice C is titled Mitigate/Control Operational Risks. Slice D is labeled Report on Operational Risks. A dot in the center of the slices is labeled Functional Area. The entire chart has arrows surrounding the outside to show that the steps inside of the slices are cyclical.
How Do Functional Areas Identify Operational Risk?
- Strategic and Operational Planning
- Business Continuity Planning
- Subject Matter Experts (SMEs)
- Daily Operations
- ELT Input
How Do Functional Areas Assess, Mitigate and Report Operational Risks?
- ERM Operational Risk Framework, Methodology, and Tool
- Continuous collaboration with Subject Matter Experts (SMEs) to maintain current data in risk tool
- Implementing controls to decrease the likelihood and/or impact or eliminate an operational risk
- Utilize operational risk data to keep leadership and CU Elevate informed
How is the Operational Risk List used?
- Strategic Planning and Execution
- Operational Planning
- Risk Awareness
- Decision Making
Related Links
Institutional Risk
Drives strategic success by annually identifying, assessing, mitigating, and reporting top institutional risks through a structured, collaborative enterprise risk management cycle.
Enterprise Risk Management
Informs and engages with institutional units to support institutional resilience and strategic success by identifying, assessing, and mitigating risks through specialized services and tools.