

Complex Images
Complex images contain complex information, like infographics, charts, diagrams and graphs. In addition to providing alternative text that summarizes a complex image, provide a long description to communicate its visual details.
Complex images can be difficult to understand by many people – especially those with low vision, learning disabilities, and limited subject-matter experience. Make long descriptions available to everyone to reach a wider audience with your content. For example, show the description as part of the main content. It may also be possible to reduce unnecessary complexity in your images and make them easier to understand for everyone.
Web Accessibility Initiative (WAI): Complex Images. Eric Eggert and Shadi Abou-Zahra, eds. Copyright © 2024 W3C®. Status: Updated 08 April 2026
Long Descriptions
Like alternative text, long descriptions provide a textual representation of the essential information conveyed by an image.
When to use long descriptions
While the Web Content Accessibility Guidelines do not define a limit for alternative text, some platforms have restrictions. As a rule of thumb, alternative text should not exceed more than a couple of sentences. When alternative text requires more than 500 characters to effectively convey an image's information, consider providing a long description.
Additionally, alternative text does not support structure like headings, lists or tables. If structure is needed, provide a long description.
Where to place long descriptions
The text surrounding a complex image may already provide enough information that a long description is not needed. When a long description is needed, place it near the complex image or in an appendix. If using the appendix approach, provide links between the complex image and its long description.
When a long description is used, reference its location in the image's alternative text.
Leverage AI for Image Descriptions
Struggling to describe a complex image? ChatGPT is surprisingly good at creating image descriptions for academic content, and with Clemson University's enterprise solution, your intellectual property is protected. Paste an image into ChatGPT and prompt it to generate an image description for you, e.g.: "Provide brief alt text and a long description that conveys the essential information within the image." Verify accuracy and make any needed adjustments.
Examples
The following examples consider static images. Dynamic or interactive visualizations require additional considerations.
Map
The alt text for the following image is "Map of the '55 Exchange location." In addition to the alt text, the address is provided in text below the image.
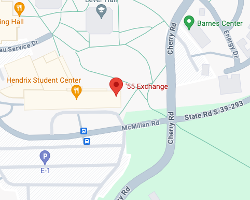 720 McMillan Rd, Clemson, SC 29634
Visualizing Data
Amy Cesal, co-founder of the Data Visualization Society, proposes the following "mad lib" as a guide for crafting alt text for charts or graphs:
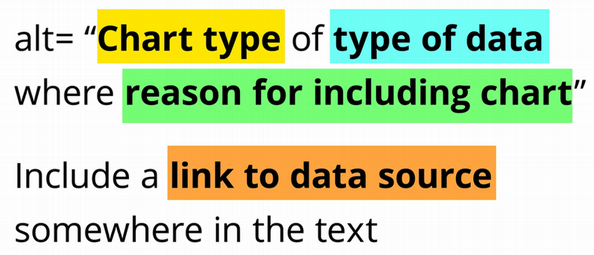
Amy Cesal, Writing Alt Text for Data Visualization
When a long description is needed, consider providing the data in an accessible format (e.g., a spreadsheet or table) so that audiences can glean their own observations from the data set.
Bar Graph
The alt text for the following fictional image is "A bar graph of popular South Carolina tourism cities where the top 5 most visited cities are Myrtle Beach, Charleston, Hilton Head, Greenville and Columbia." Additionally, the data is presented in a table.
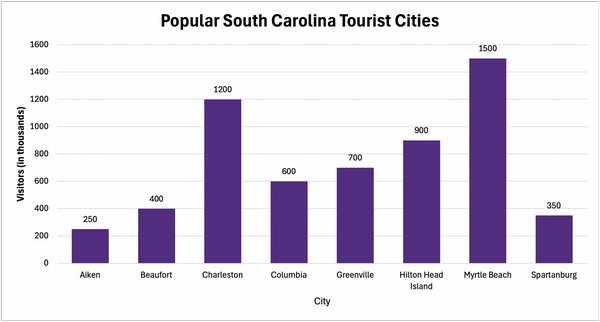
| Destination | Number of Visitors (in thousands) |
|---|---|
| Aiken | 250 |
| Beaufort | 400 |
| Charleston | 1200 |
| Columbia | 600 |
| Greenville | 700 |
| Hilton Head Island | 900 |
| Myrtle Beach | 1500 |
| Spartanburg | 350 |
Pie Chart
The following fictional pie chart contains only brief alt text that provides equivalent information. Because this is a simple chart, a long description is not needed.
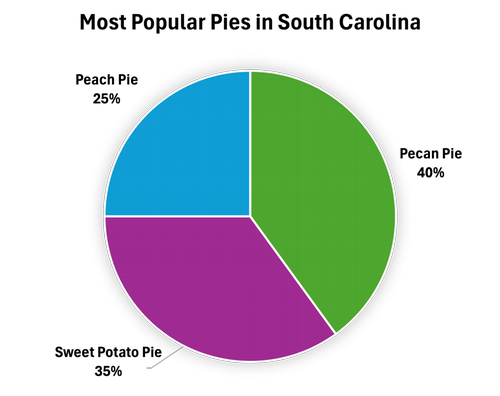
The alt text for this pie chart is "A pie chart of popular pie flavors in South Carolina where pecan pie is the most popular (40%), followed by sweet potato pie (35%) then peach pie (25%)."
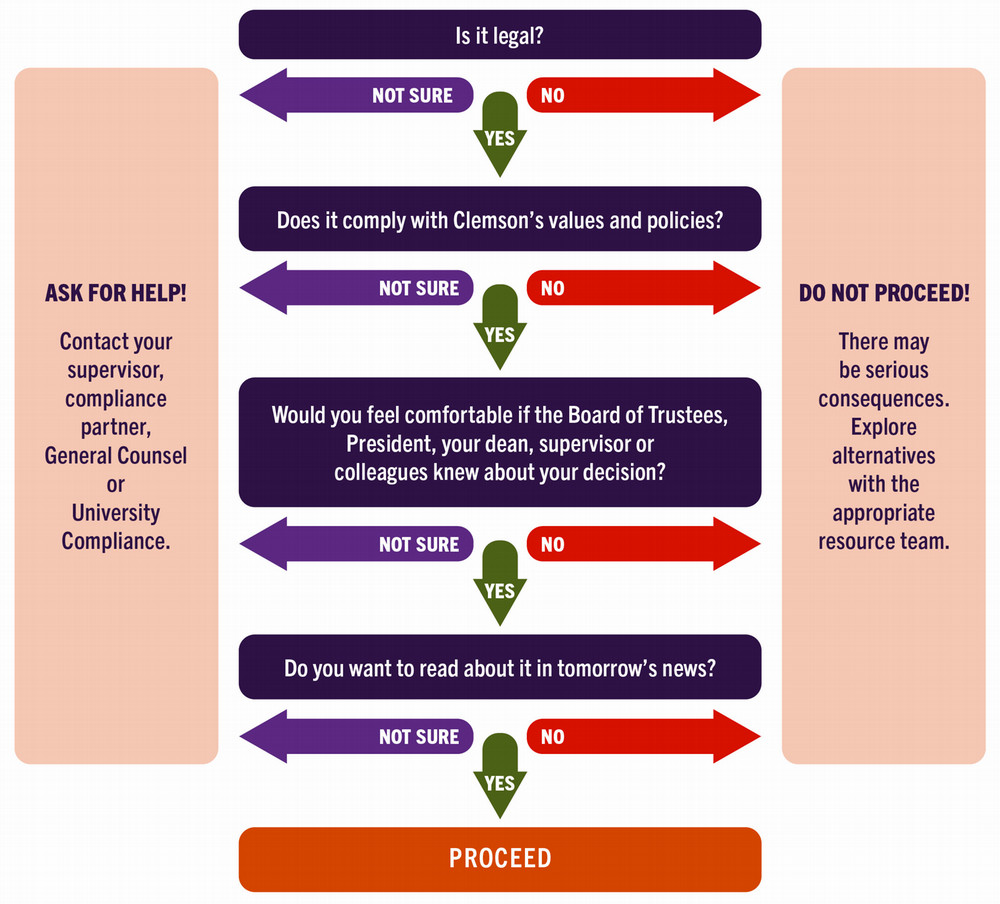
Flow Chart
Flow charts typically require a long description. Strategies for long descriptions for flow charts include:
- A narrative description in real text
- The same content as a nested list (like an outline) in real text
- An accessible PDF that conveys the flowchart's structure
In the following example, from the Office of University Compliance and Ethics website, a decision flow chart's alternative text is "Flow chart of making a difficult decision. Detailed information can be found in the image description below." A long description follows the flowchart.
Infographics
WebAIM has a well-executed example of an accessible infographic: Web Accessibility for Designers. The alt text for the infographic is brief: "Web Accessibility for Designers infographic with text description below." A full text alternative is provided following the image.