Skip to content

Agribusiness

2024 FarmGate Reports

Overview

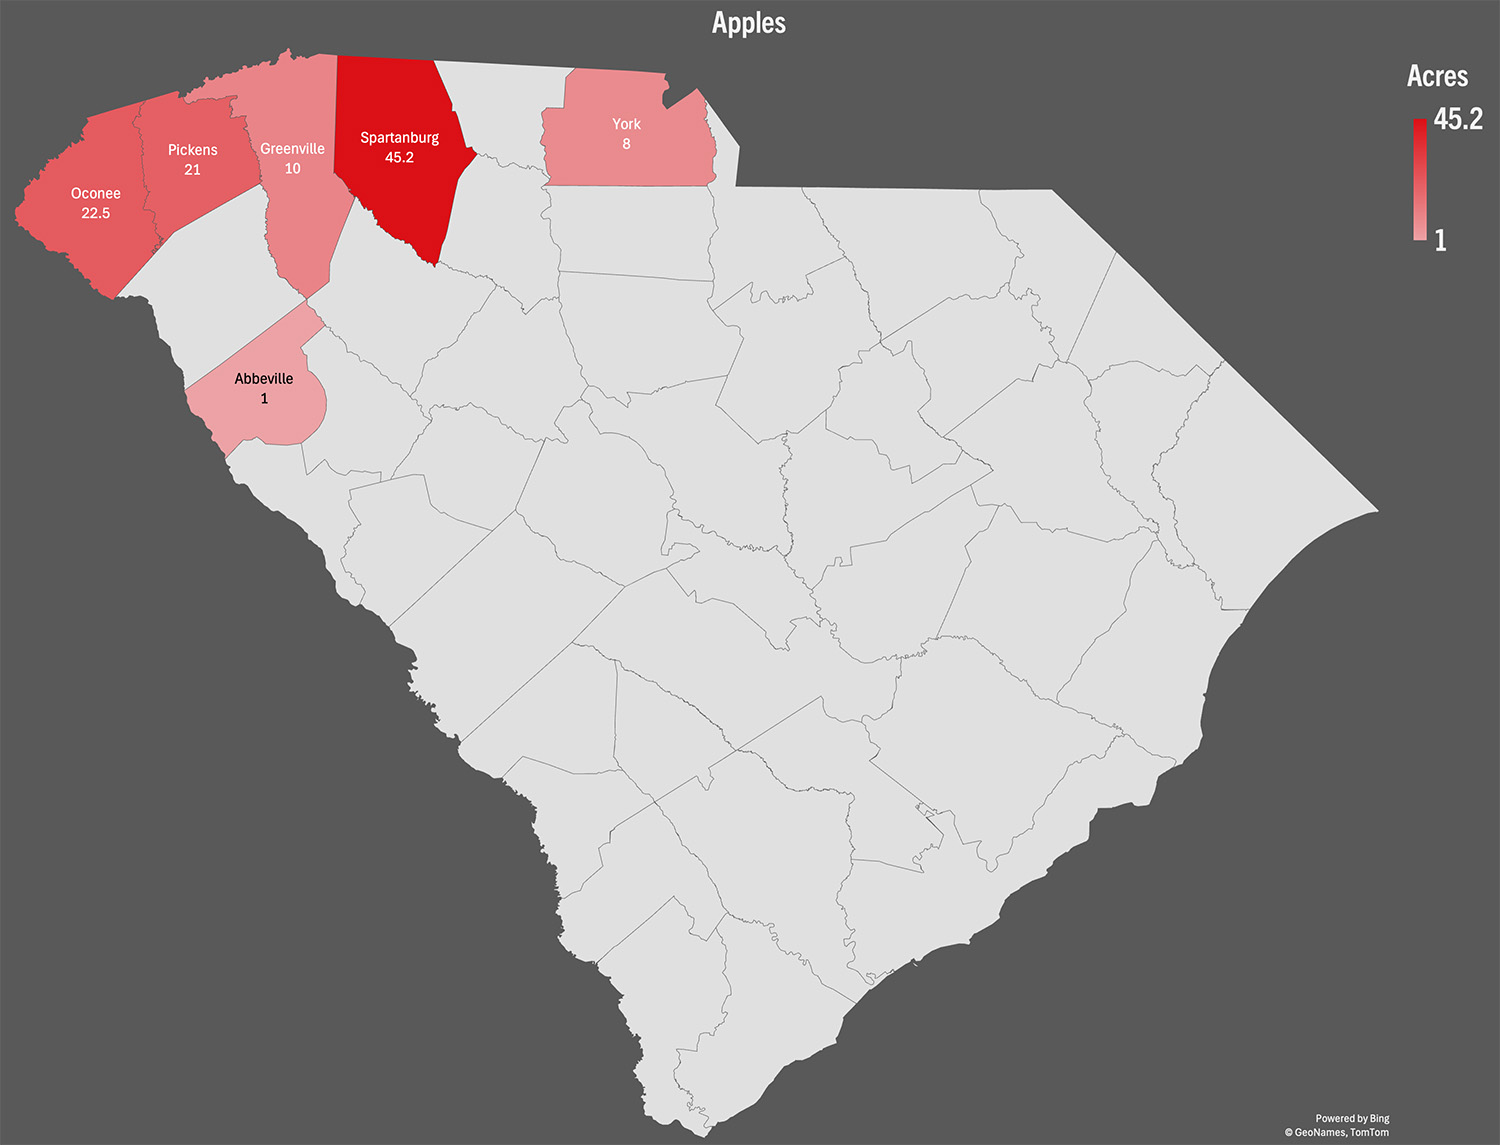
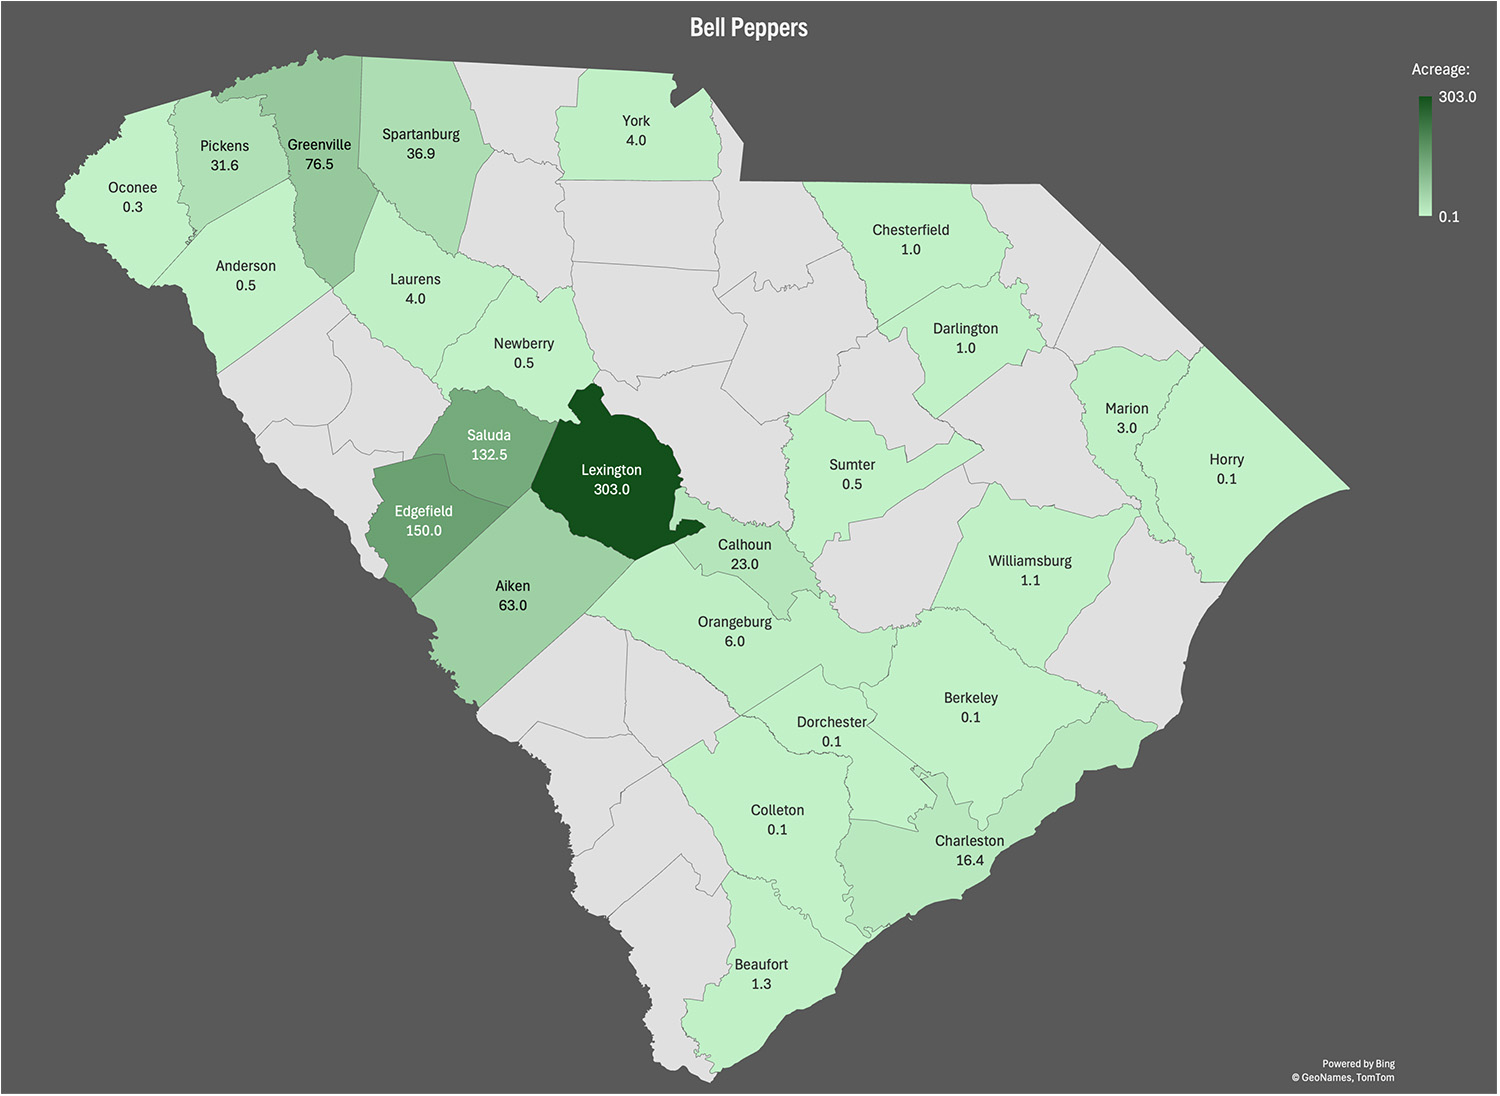
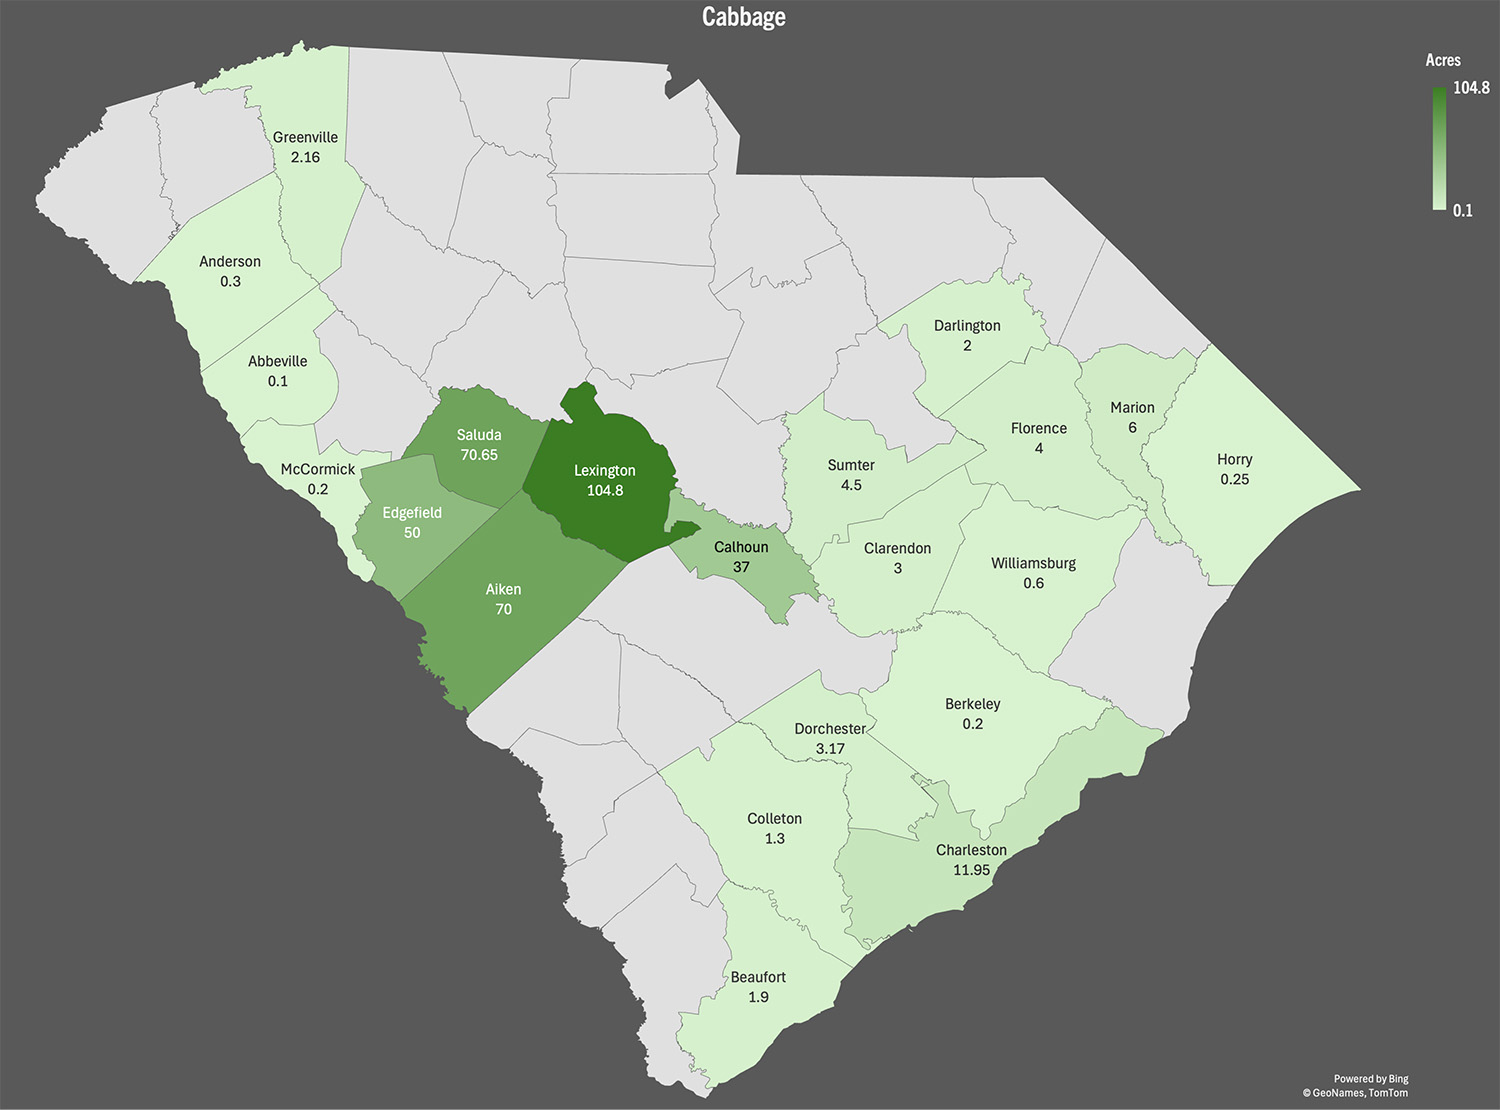
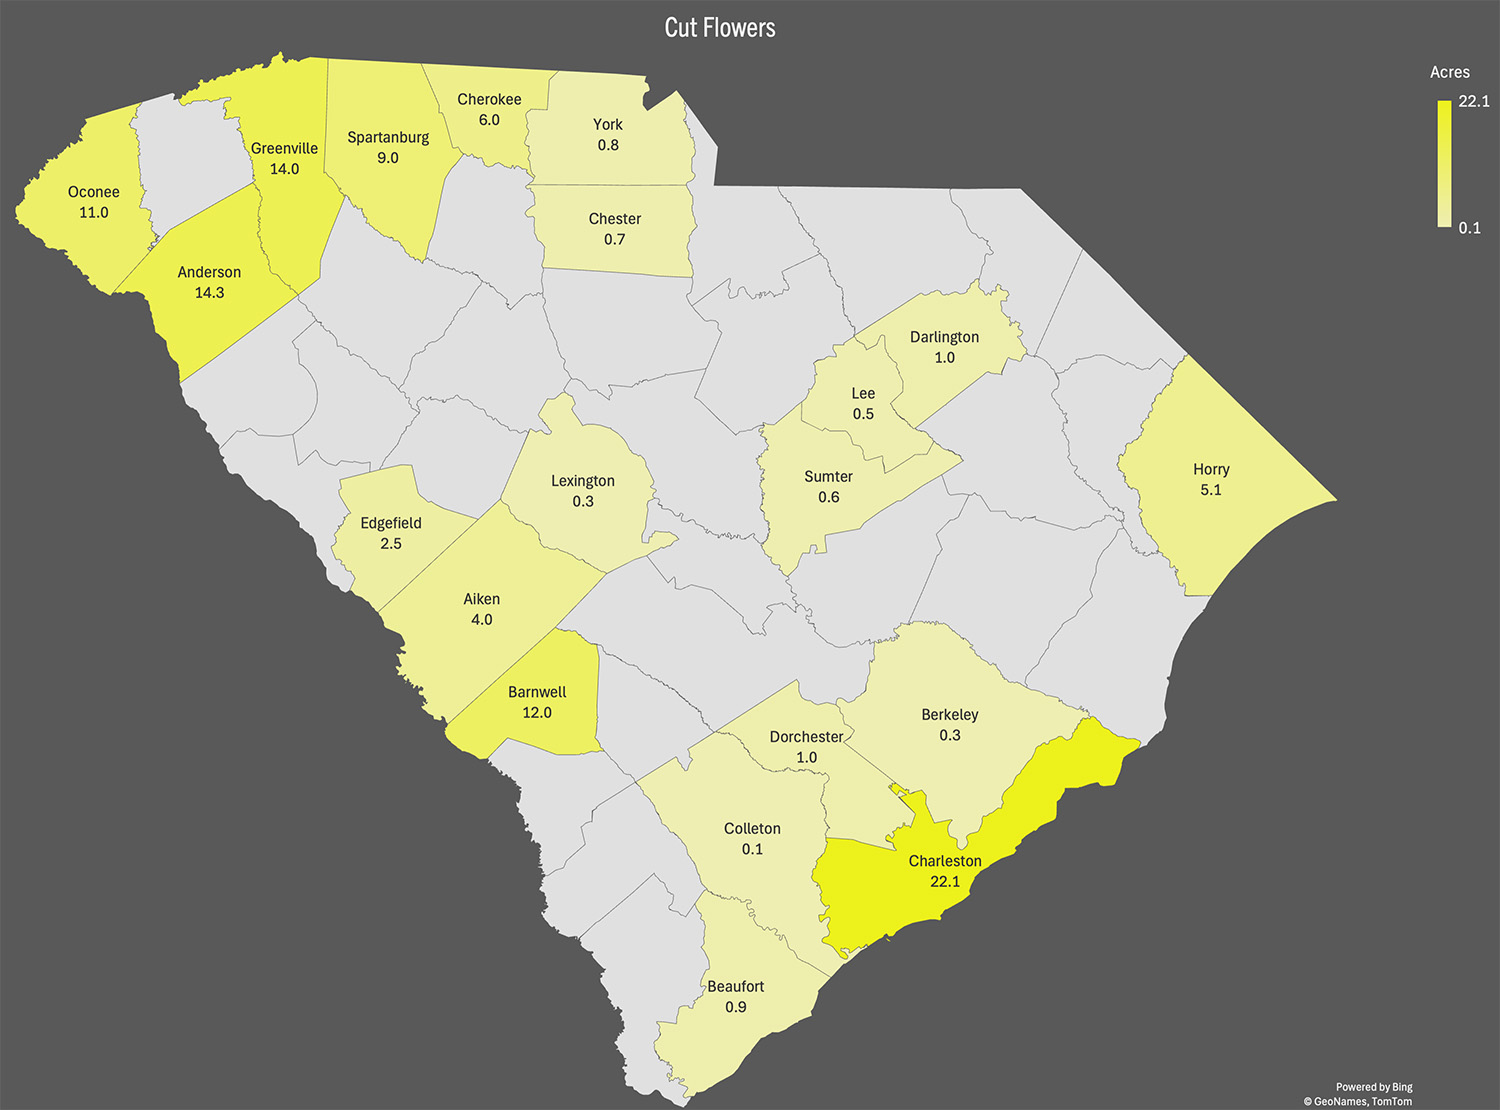
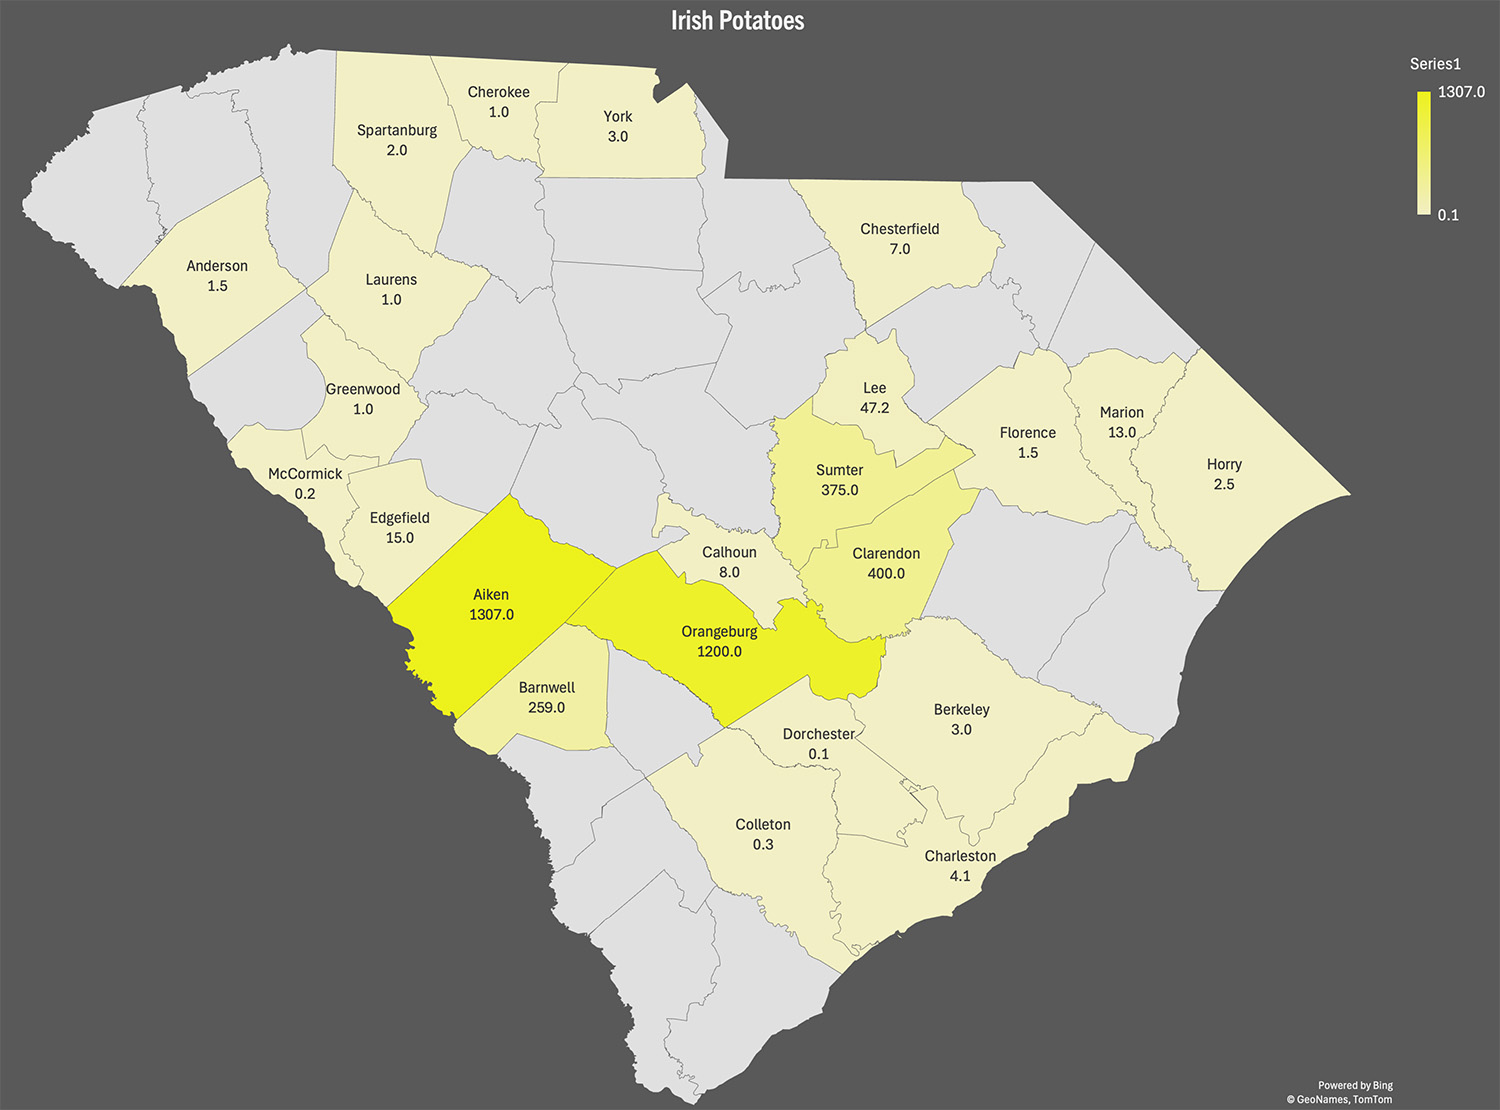
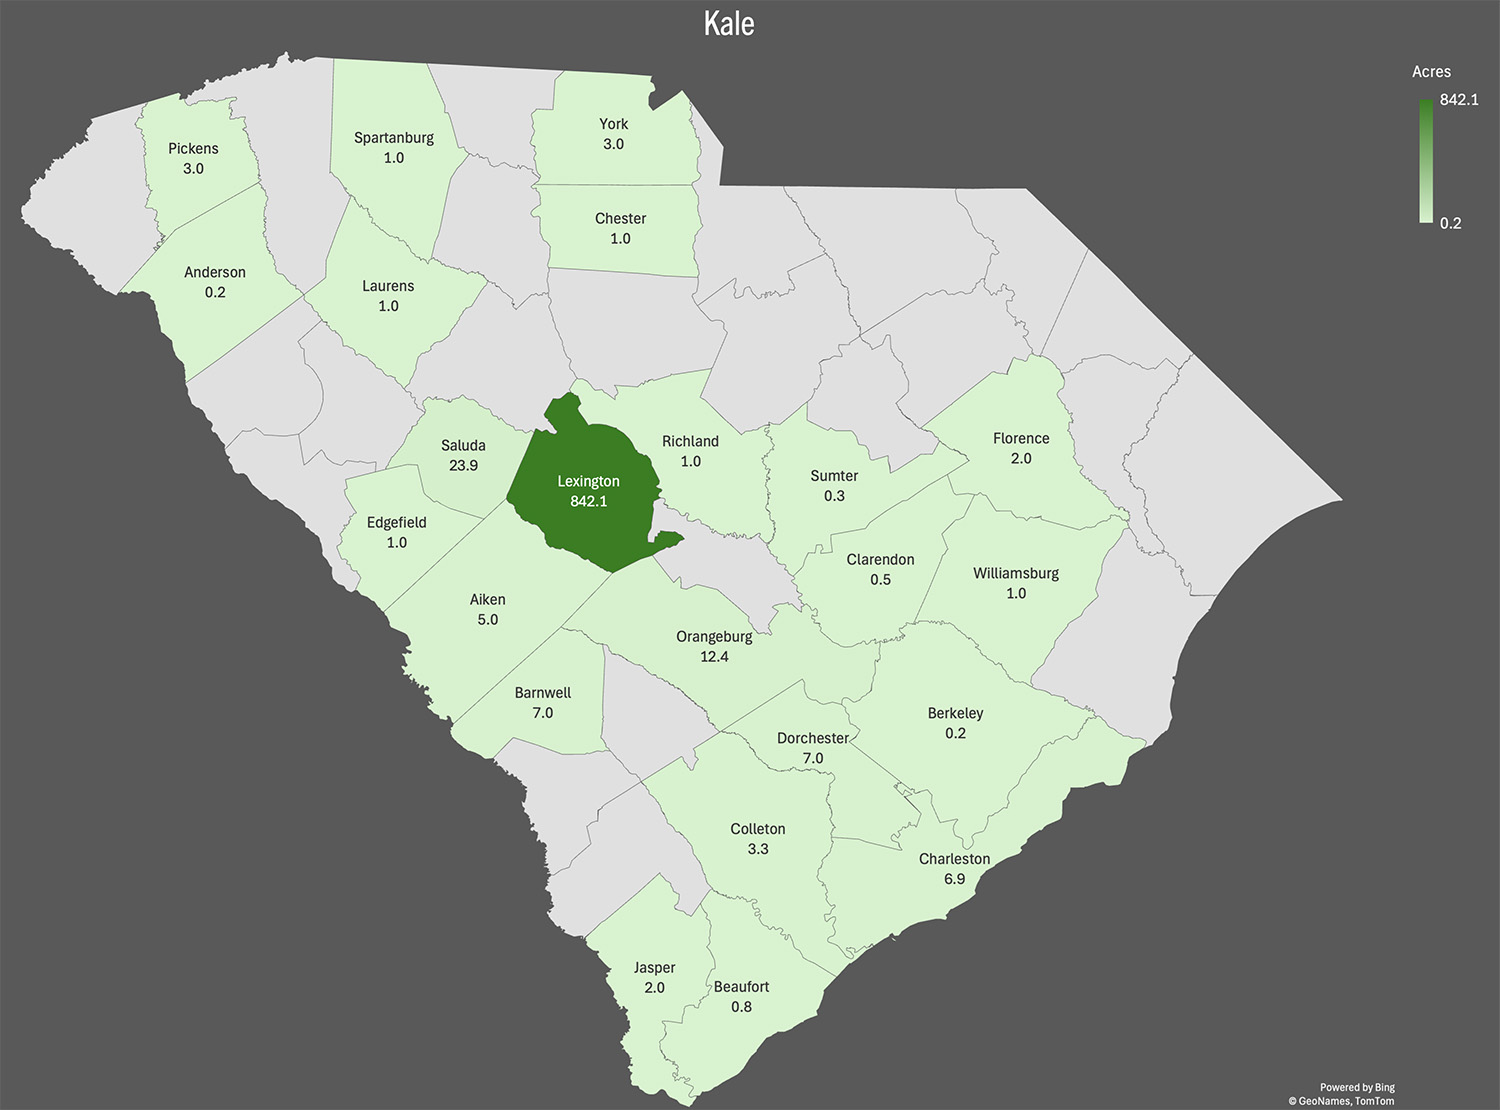
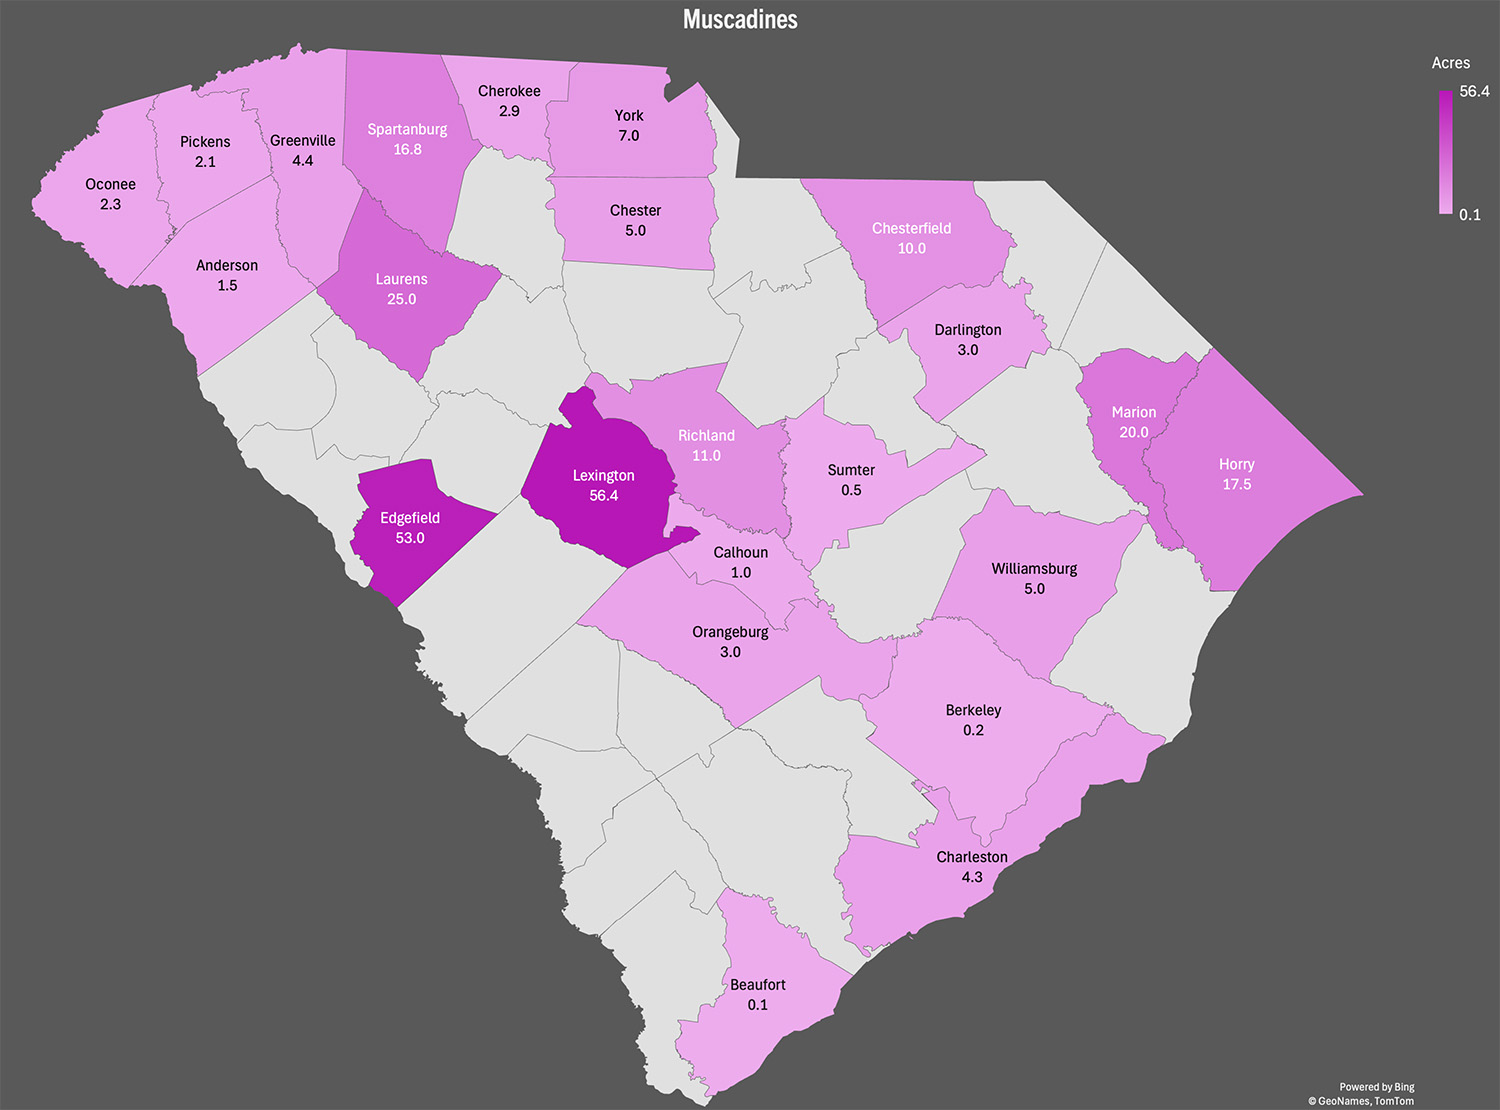
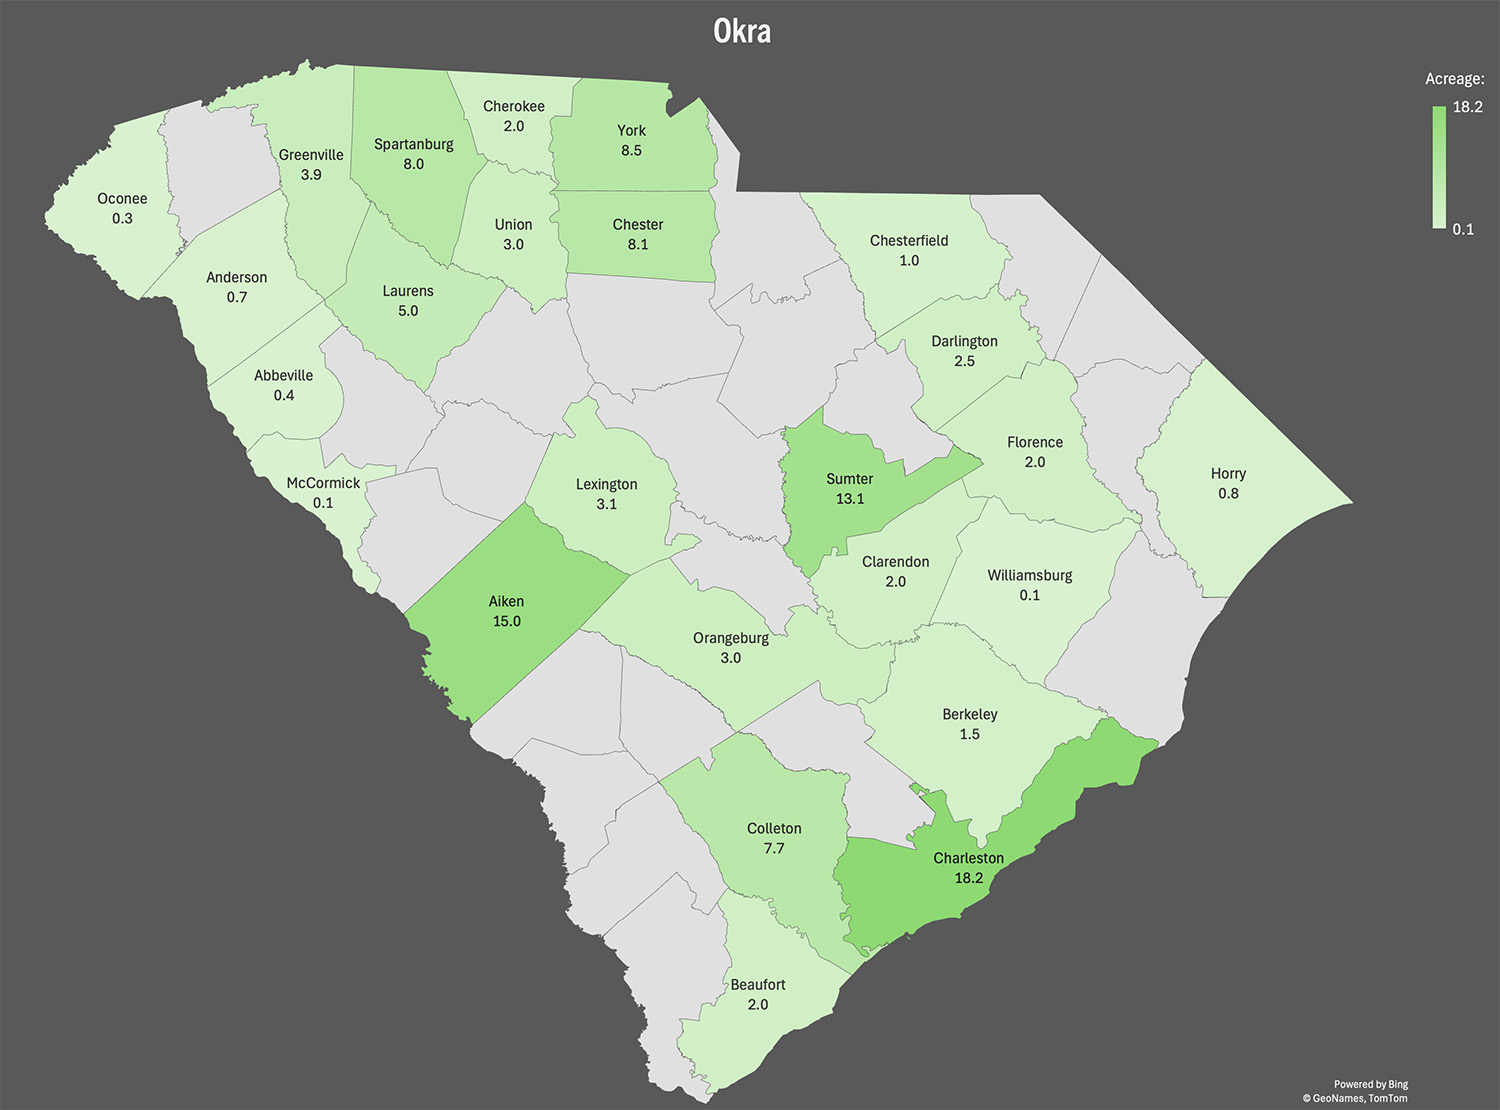
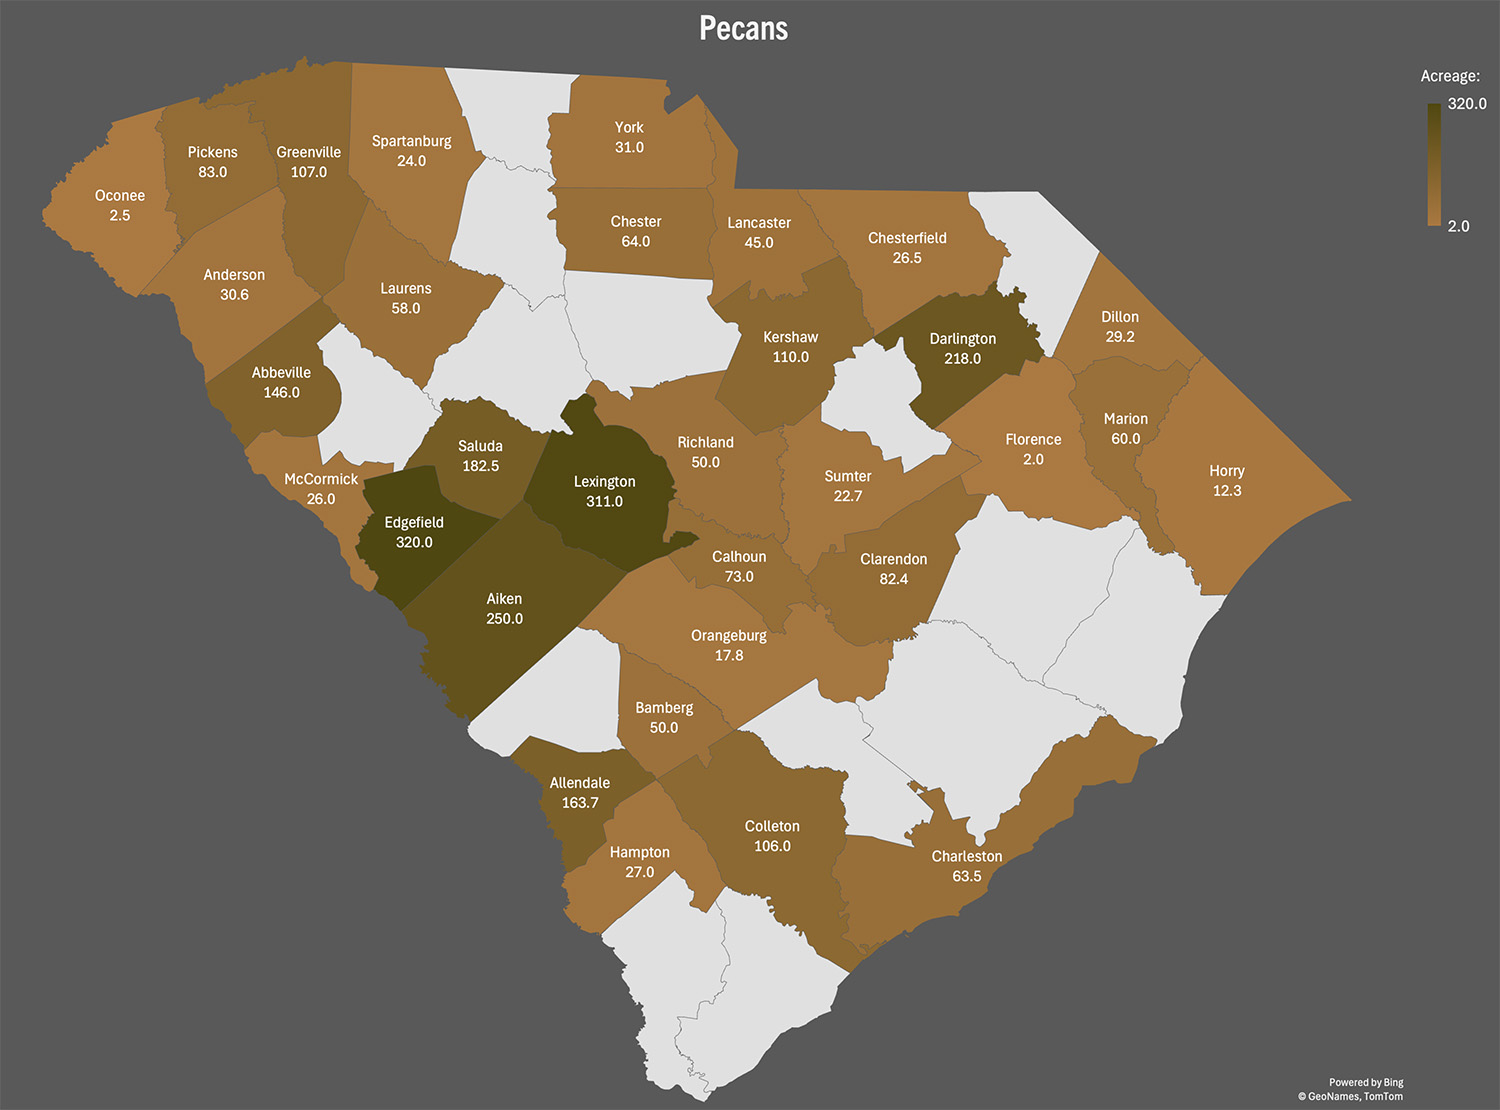
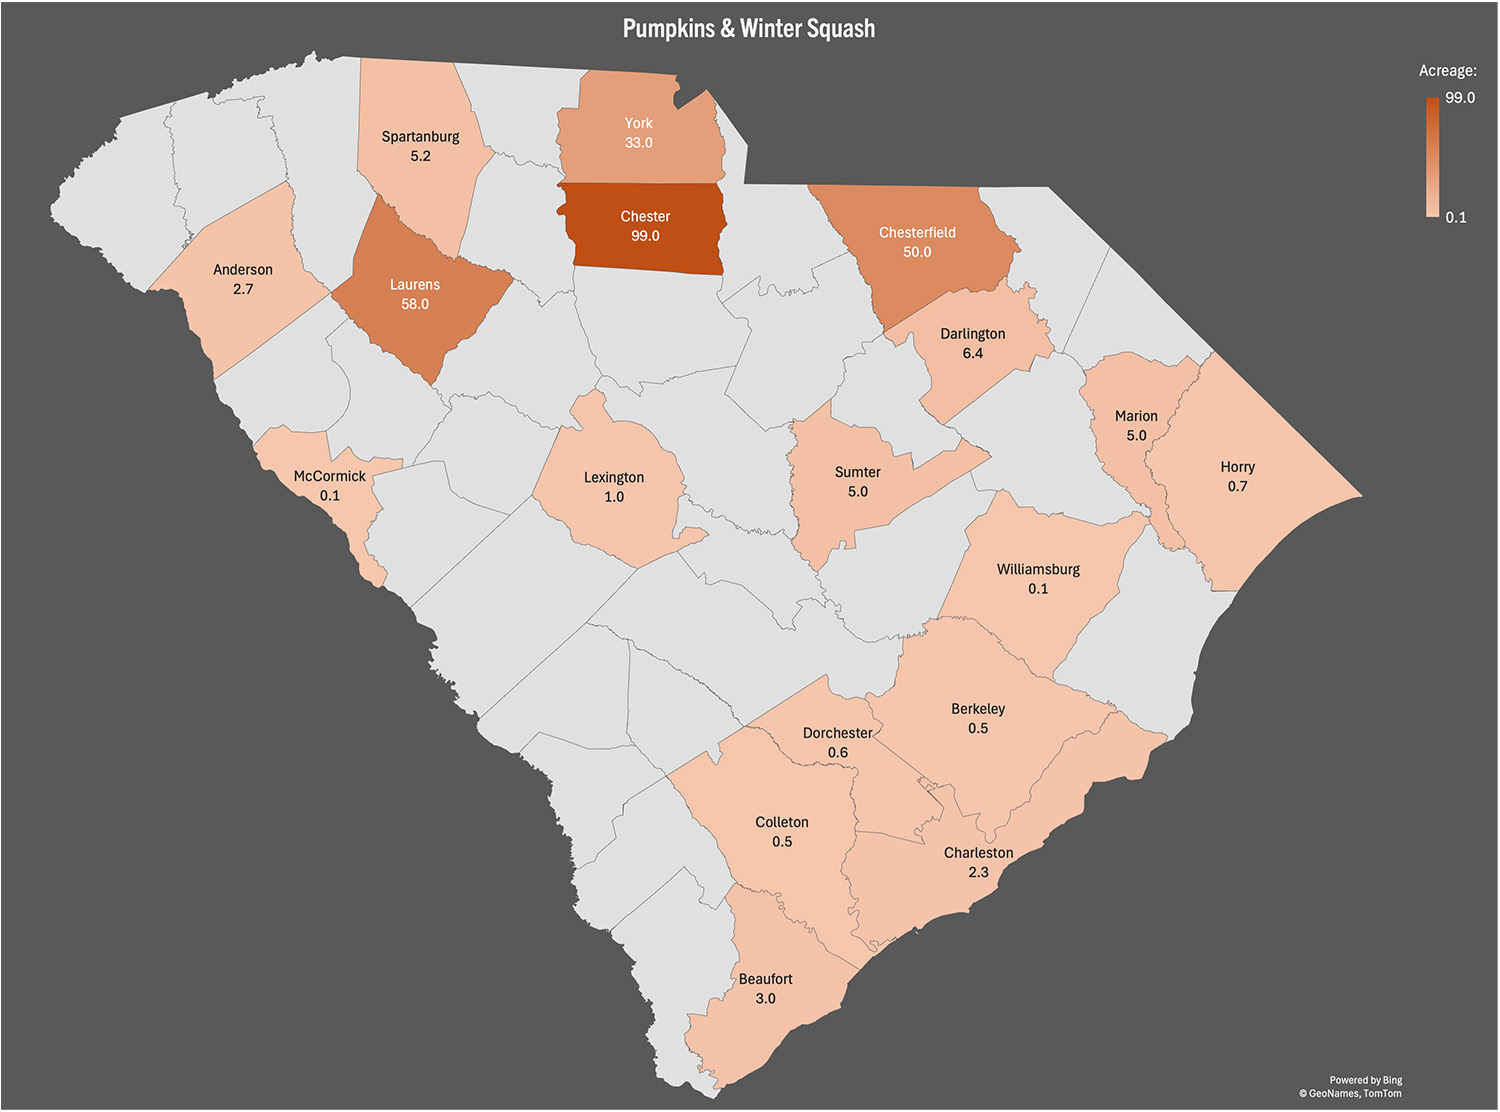
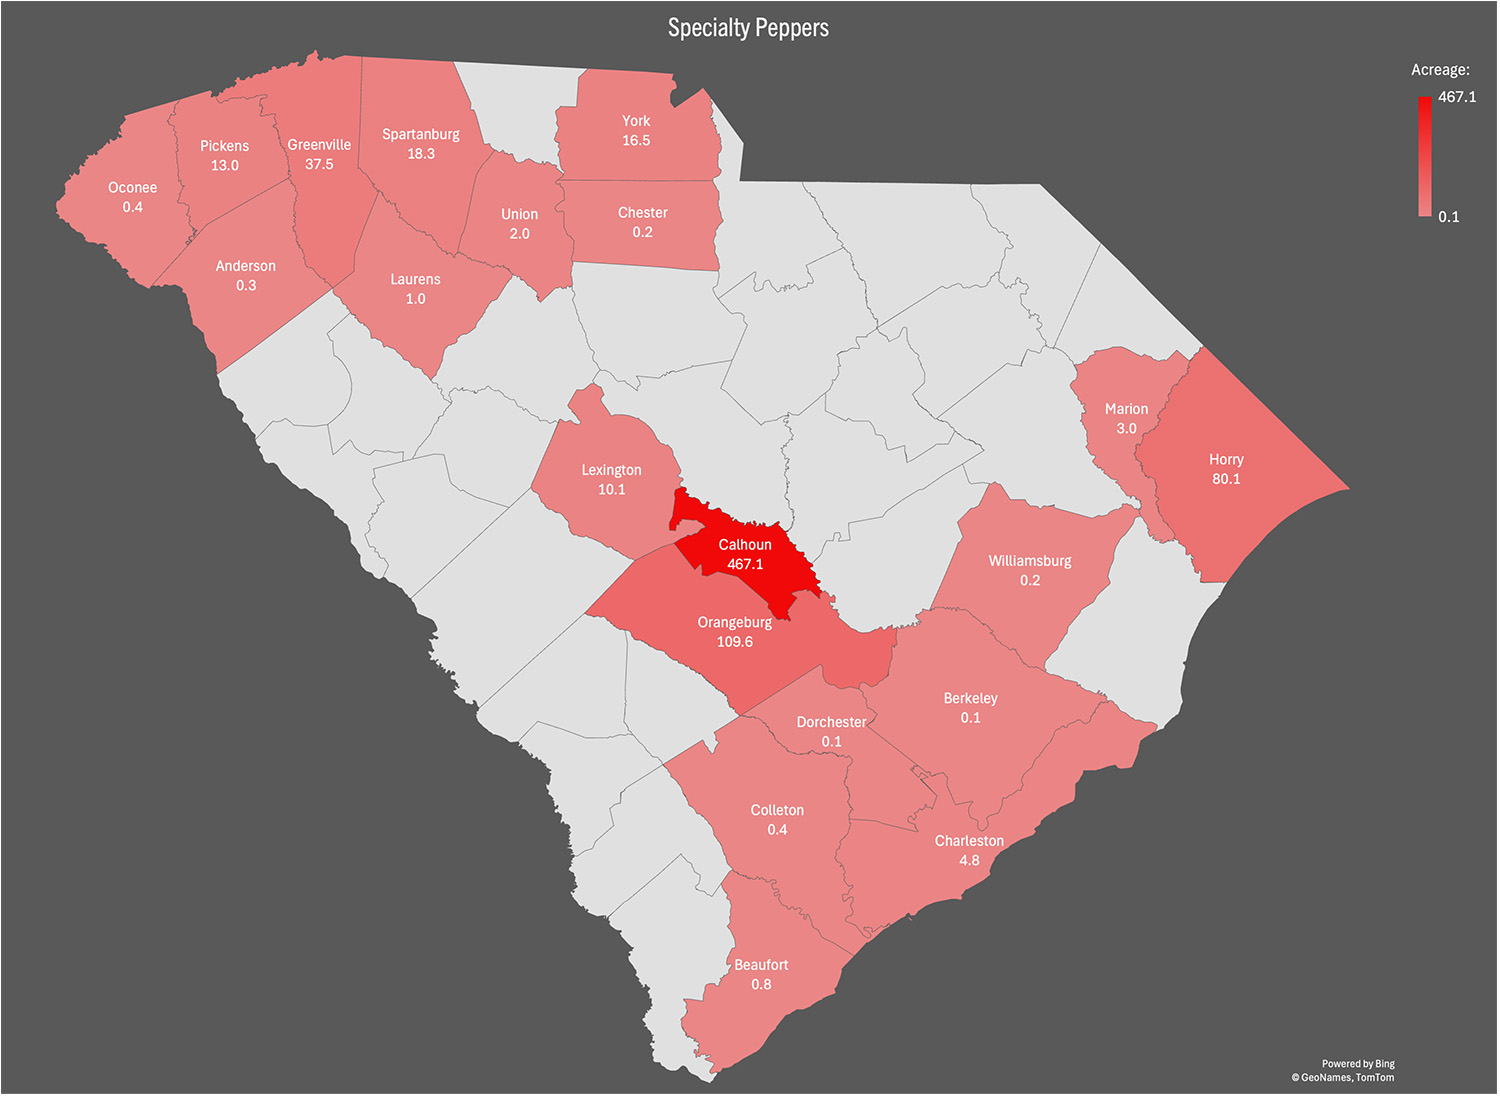
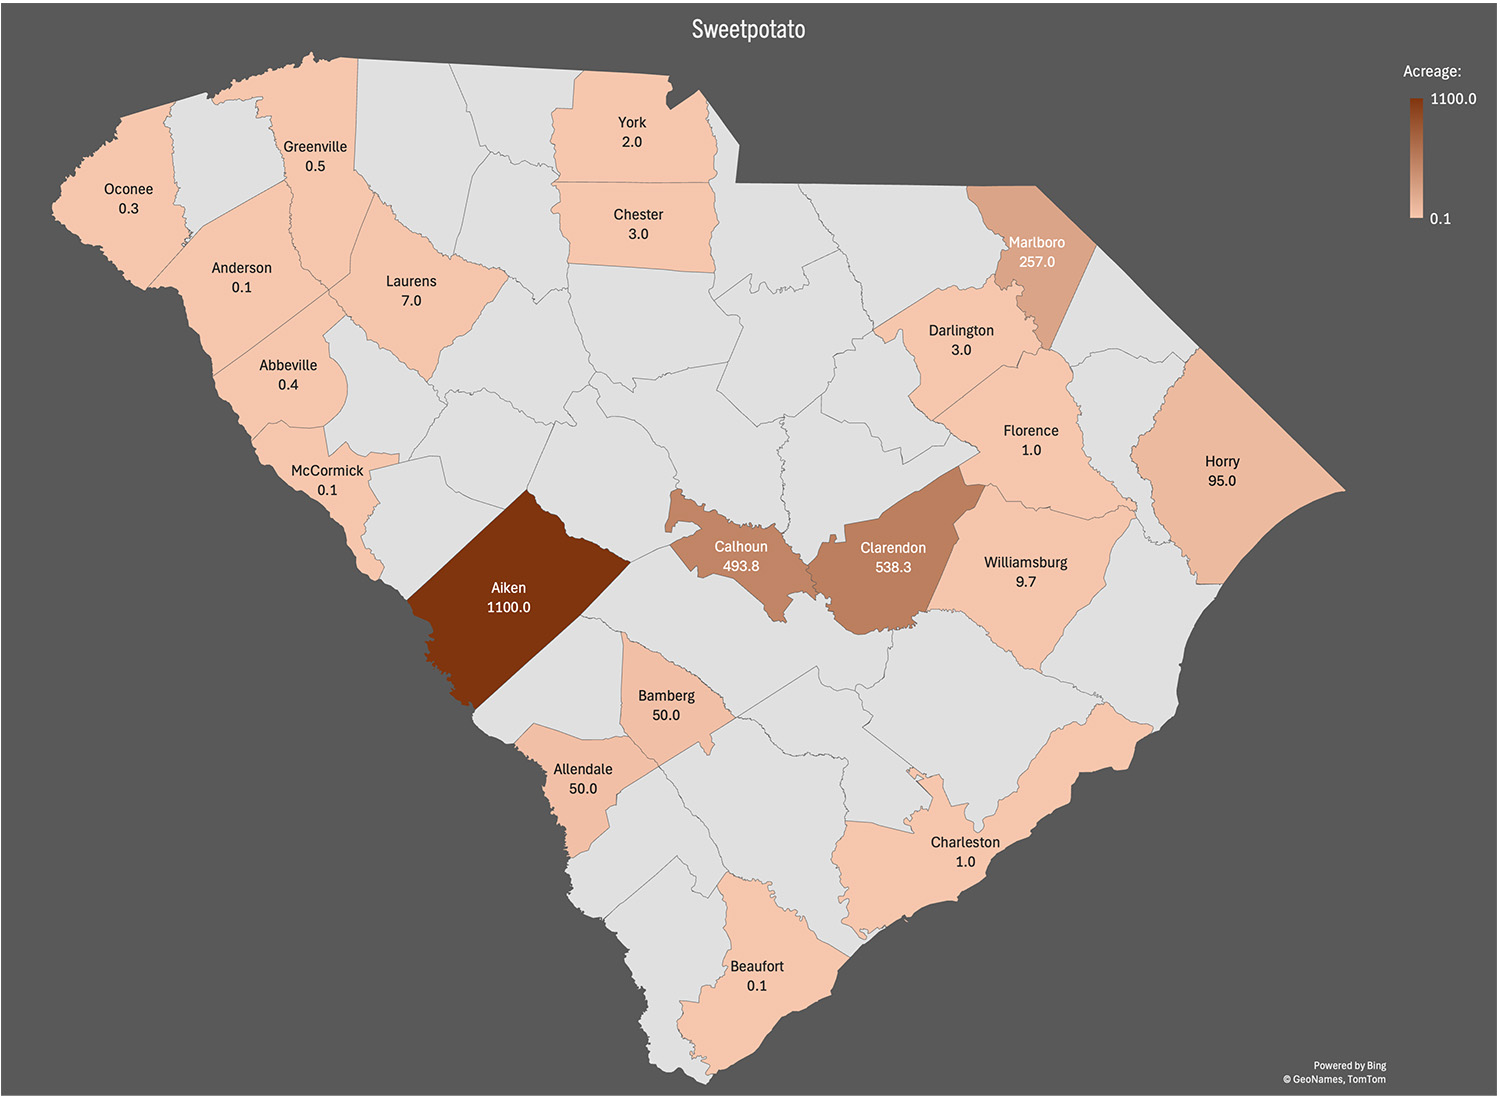
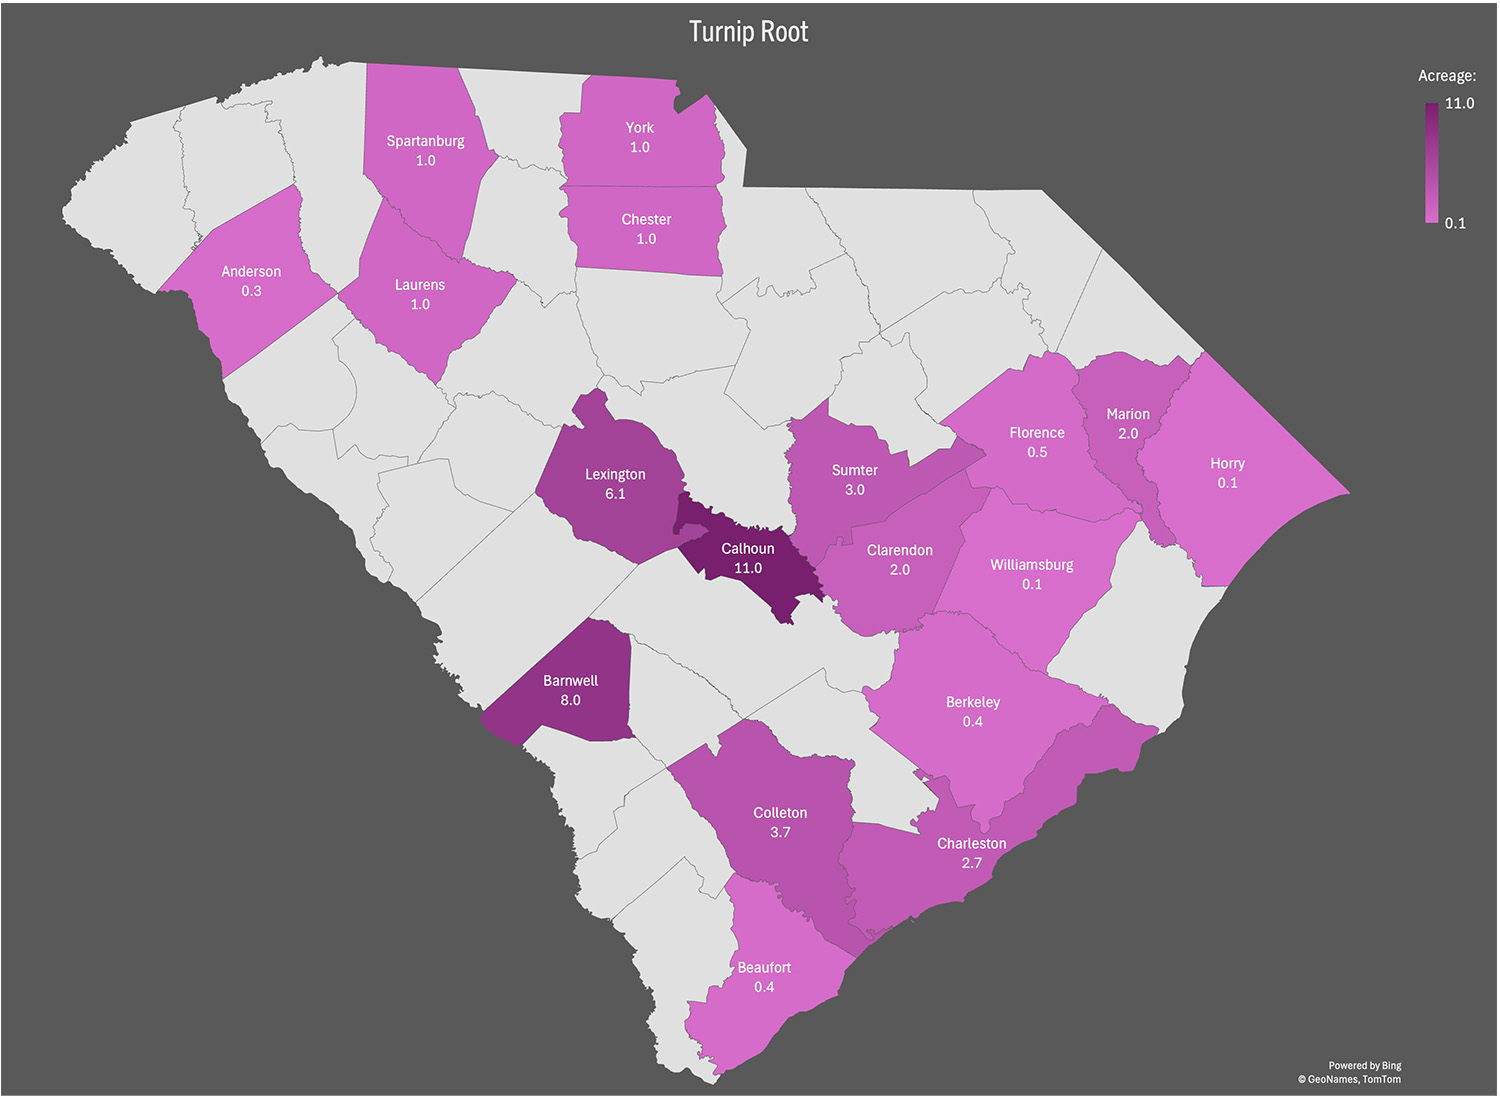
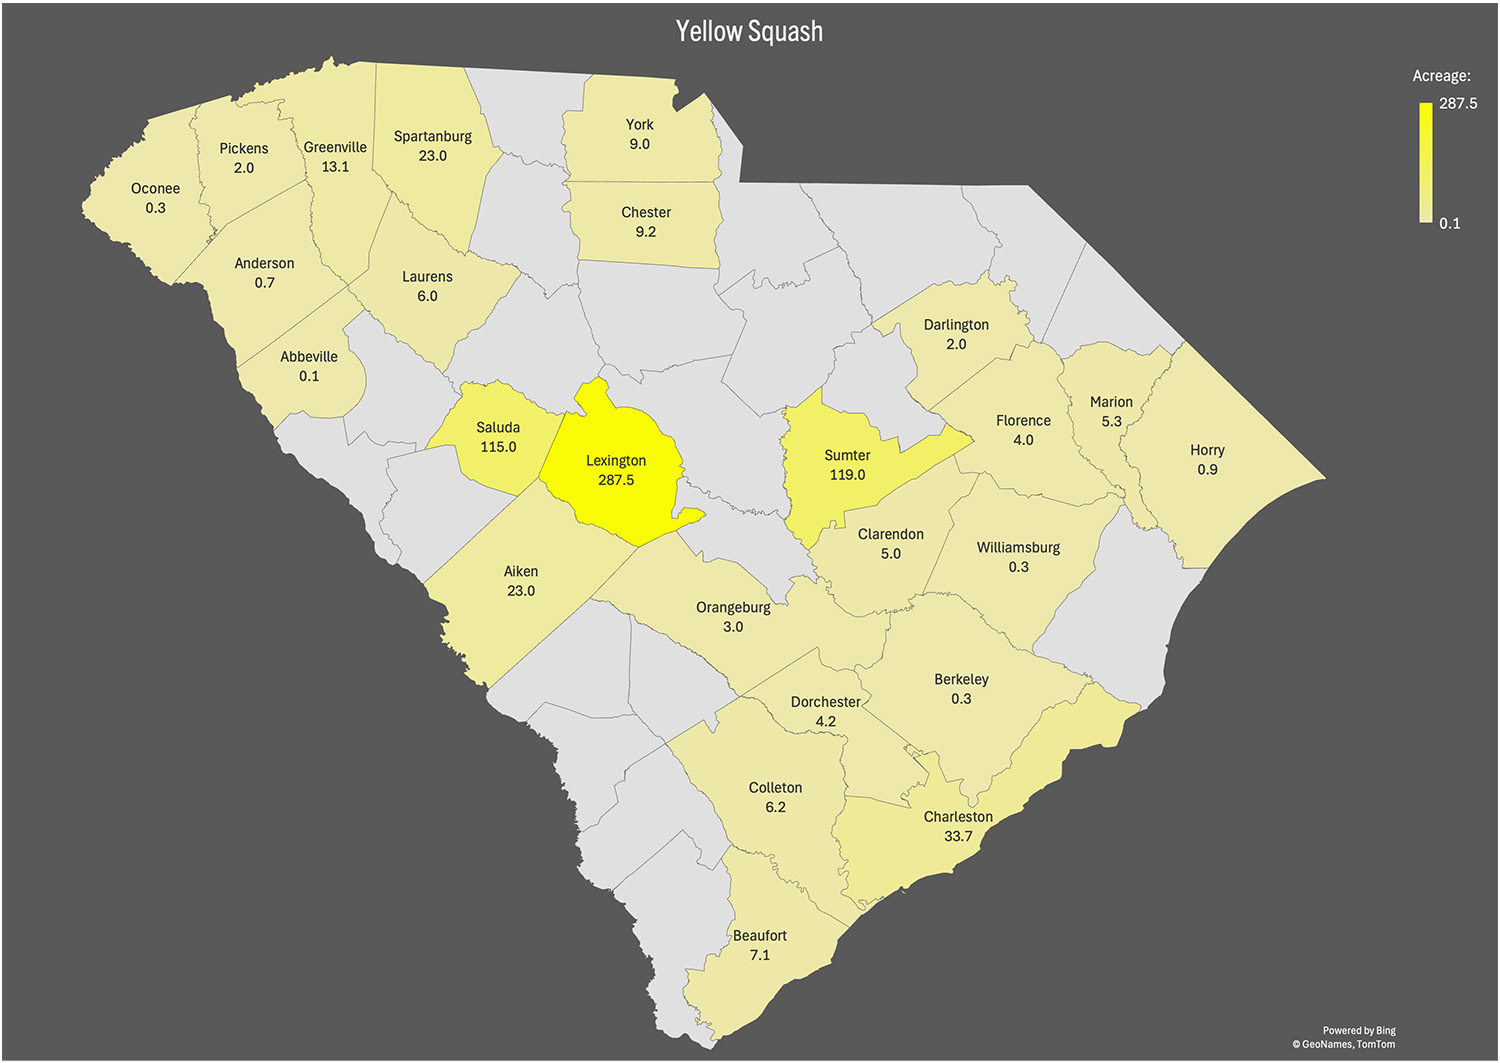
In fall of 2024, Extension Agents throughout South Carolina surveyed growers on specialty crop acreage for the year. The goal was to identify the counties of production, acreage, and observable market prices for the year.

* = Data retrieved from USDA or FSA.
If you are aware of missing acreage, please contact your
local horticulture extension agent or email kburke5@clemson.edu.

This is a collaborative project between Clemson Extension Horticulture and Agribusiness teams.

Apples

Download Apples (DOCX)
  • Total Number of Counties: 6
  • Total Acreage: 109.7
  • Highest Acreage: Spartanburg County
  • Organic Acreage: None
  • Processing Acreage: 25.5

Estimated Value:

  • Observed Prices: $30.00 per bushel
  • Estimated Yield: 900 bushels per acre
  • Total Yield: 109.7 × 900 bushels per acre × $30.00 per bushel = $2,961,900 total value
Acreage By County
County Acreage
Abbeville 3.0
Greenville 10.0
Oconee 22.5
Pickens* 21.0
Spartanburg* 45.2
York 8.0
apple map

Figure 1: Cumulative acres per county

Cabbage

Download Cabbage (DOCX)
  • Total Number of Counties: 21
  • Total Acreage: 374.08
  • Highest Acreage: Lexington County
  • Organic Acreage: 175.5
  • Processing Acreage: 37

Estimated Value:

  • Observed Prices: $17.00 – $28.00 per 50 lb. carton
  • Estimated Yield: 650 (50 lb.) cartons per acre
  • Total Yield: 374.08 × 650 cartons per acre × $21.00 per carton = $5,106,192 total value
Acreage By County
County Acreage
Abbeville 0.1
Aiken 70
Anderson 0.3
Beaufort 1.9
Berkeley 0.2
Calhoun* 37.0
Charleston 11.95
Clarendon 3.0
Colleton 1.3
Darlington 2.0
Dorchester 3.17
Edgefield 50.0
Florence 4.0
Greenville* 2.16
Horry 0.25
Lexington 104.8
Marion 6.0
McCormick 0.2
Saluda* 70.65
Sumter 4.5
Williamsburg 0.6
cabbage map

Figure 1: Cumulative acres per county

Cut Flowers

Download Cut Flowers (DOCX)
  • Total Number of Counties: 20
  • Total Acreage: 105.9
  • Highest Acreage: Charleston County
  • Organic Acreage: 0.1
  • Processing Acreage: 0.0

Estimated Value:

  • Observed Prices: N/A
  • Estimated Yield: N/A
  • Total Yield: N/A
Acreage By County
County Acreage
Aiken 4.0
Anderson 14.3
Barnwell 12.0
Beaufort 0.9
Berkeley 0.3
Charleston 22.1
Cherokee* 6.0
Chester* 0.7
Colleton 0.1
Darlington 1.0
Dorchester 1.0
Edgefield 2.5
Greenville* 14.0
Horry 5.1
Lexington 0.3
Lee 0.5
Oconee* 11.0
Spartanburg* 9.0
Sumter 0.6
York 0.8
cut-flowers map

Figure 1: Cumulative acres per county

Irish Potatoes

Download Irish Potatoes (DOCX)
  • Total Number of Counties: 23
  • Total Acreage: 3658.4
  • Highest Acreage: Aiken County
  • Organic Acreage: 0.0
  • Processing Acreage: 2900

Estimated Value:

  • Observed Prices: $.50 - $1.20 per lb.
  • Estimated Yield: 16,000 lbs. per acre
  • Total Yield: 58,534,400 lbs. × $.60 per lb. = $35,120,640 total value
Acreage By County
County Acreage
Aiken 1307.0
Anderson 1.5
Barnwell* 259.0
Berkeley 3.0
Calhoun 8.0
Charleston 4.1
Cherokee* 1.0
Chesterfield* 7.0
Clarendon 400.0
Colleton 0.3
Dorchester 0.1
Edgefield 15.0
Florence 1.5
Greenwood 1.0
Horry 2.5
Laurens* 1.0
Lee* 47.2
Marion 13.0
McCormick 0.2
Orangeburg 1200.0
Spartanburg* 2.0
Sumter* 375.0
York* 3.0
irish potatoes map

Figure 1: Cumulative acres per county

Kale

Download Kale (DOCX)
  • Total Number of Counties: 23
  • Total Acreage: 925.4
  • Highest Acreage: Lexington County
  • Organic Acreage: 17.4
  • Processing Acreage: N/A

Estimated Value:

  • Observed Prices: $15.00 - $18.00 per carton
  • Estimated Yield: 680 (25 lb.) cartons per acre
  • Total Yield: 925.4 × 680 cartons per acre
    × $16.05 per carton = $10,099,815 total value
Acreage By County
County Acreage
Aiken 5.0
Anderson 0.2
Barnwell 7.0
Beaufort 0.8
Berkeley 0.2
Charleston 6.9
Chester* 1.0
Clarendon 0.5
Colleton 3.3
Dorchester 7.0
Edgefield 1.0
Florence 2.0
Jasper 2.0
Laurens* 1.0
Lexington 842.1
Orangeburg* 12.4
Pickens 3.0
Richland 1.0
Saluda* 23.9
Spartanburg* 1.0
Sumter 0.3
Williamsburg 1.0
York* 3.0
kale map

Figure 1: Cumulative acres per county

Muscadines

Download Muscadine (DOCX)
  • Total Number of Counties: 24
  • Total Acreage: 315.0
  • Highest Acreage: Lexington County
  • Organic Acreage: 33.4
  • Processing Acreage: 86.41

Estimated Value:

  • Observed Prices: $28.00 - $42.00 per ½ bushel
  • Estimated Yield: 550 ½ bushels (22 lbs.) per acre
  • Total Yield: 315.0 × 550 ½ bushels per acre × $32.00 per ½ bushel = $5,544,000 total value
Acreage By County
County Acreage
Anderson 1.5
Beaufort 0.1
Berkeley 0.2
Calhoun 1.0
Charleston 17.3
Cherokee* 2.9
Chester* 5.0
Chesterfield 10.0
Darlington 3.0
Edgefield 53.0
Greenville* 4.4
Horry 17.5
Laurens* 25.0
Lexington 56.4
Marion 20.0
Oconee 2.3
Orangeburg 3.0
Pickens 2.1
Richland 11.0
Saluda 50.0
Spartanburg* 16.8
Sumter 0.5
Williamsburg 5.0
York* 7.0
muscadine map

Figure 1: Cumulative acres per county

undefined

Okra

Download Okra (DOCX)
  • Total Number of Counties: 25
  • Total Acreage: 111.9
  • Highest Acreage: Charleston County
  • Organic Acreage: 3.4
  • Processing Acreage: 0.3

Estimated Value:

  • Observed Prices: $26.00 - $36.00 per ½ bushel
  • Estimated Yield: 720 ½ bushels (15 lbs.) per acre
  • Total Yield: 111.9 x 720 ½ bushels per acre × $30.00 per ½ bushel = $2,417,040 total value
Acreage By County
County Acreage
Abbeville 0.4
Aiken 15.0
Anderson 0.7
Beaufort 2.0
Berkeley 1.5
Charleston 18.2
Cherokee 2.0
Chester 8.1
Chesterfield 1.0
Clarendon 2.0
Colleton 7.7
Darlington 2.5
Florence 2.0
Greenville 3.9
Horry 0.8
Laurens 5.0
Lexington 3.1
McCormick 0.1
Oconee 0.3
Orangeburg 3.0
Sumter 13.1
Spartanburg 3.0
Union 0.1
Williamsburg 0.1
York 8.5
okra map

Figure 1: Cumulative acres per county

Pecans

Download Pecans (DOCX)
  • Total Number of Counties: 32
  • Total Acreage: 2794.6
  • Highest Acreage: Edgefield County
  • Organic Acreage: 12.75
  • Processing Acreage:  210

Estimated Value:

  • Observed Prices: $160 per 50 lb. sack (unshelled)
  • Estimated Yield: 24 bushels (50 lb.) per acre
  • Total Yield: 2794.6 × 24 bushels per acre × $160.00 per 50 lb. sack = $10,731,264 total value
Acreage By County
County Acreage
Abbeville* 146.0
Aiken 250.0
Allendale 163.7
Anderson 30.6
Bamberg 50.0
Calhoun* 73.0
Charleston 63.5
Chester* 64.0
Chesterfield* 26.5
Clarendon* 82.4
Colleton* 106.0
Darlington* 218.0
Dillon* 29.2
Edgefield 320.0
Florence 2.0
Greenville* 107.0
Hampton* 27.0
Horry 12.3
Kershaw 110.0
Lancaster* 45.0
Laurens* 58.0
Lexington* 311.0
Marion* 60.0
McCormick* 26.0
Oconee 2.5
Orangeburg 17.8
Pickens* 83.0
Richland 50.0
Saluda* 182.5
Sumter 22.7
Spartanburg* 24.0
York* 31.0
pecans map

Figure 1: Cumulative acres per county